


A dashboard drops from 95% to 85%, and you spend your next study break changing settings instead of reviewing. Before you give that number your time, check what it counted: a flashcard retention rate needs a numerator, a denominator, and a time window.
An observed pass rate is successful eligible attempts divided by all eligible attempts. It does not automatically describe every card in your collection, your chance of passing an exam, or your recall next month. This article uses original, fully synthetic examples and a reproducible probability calculation. There is no Memly user dataset or product-effectiveness estimate behind the numbers below.
Three percentages that answer different questions
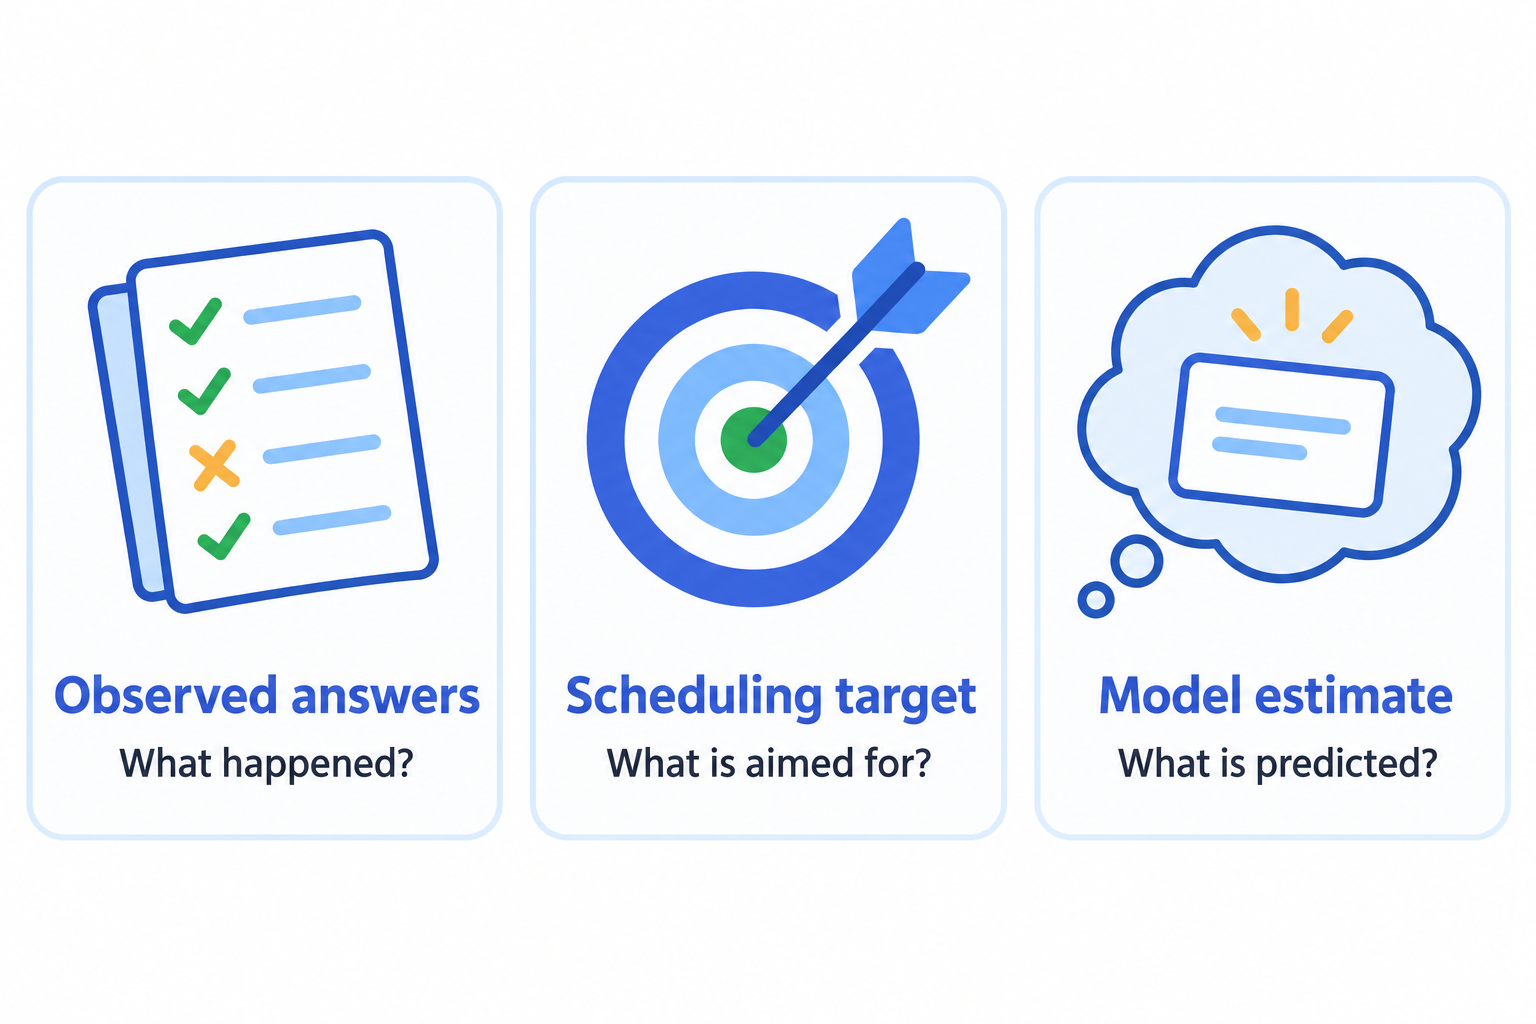
Start by naming the quantity. An observed rate describes answers already recorded. A desired retention setting tells a scheduler what probability to target. A model's retrievability estimate describes a predicted chance of recall for a card at a particular time. They can be related without being interchangeable.
- Observed pass rate: what fraction of the attempts included in this report passed its rule?
- Desired retention: what recall probability is the scheduler targeting when it schedules reviews?
- Estimated retrievability: what chance of recall does the model assign now?
Anki's desired-retention documentation describes the setting as a probability target for scheduled reviews. A target of 90% is not a promise that your next twenty answers will contain exactly two failures. For the scheduling side, see our FSRS explanation.
How twenty cards can produce two different pass rates
Here is a deliberately constructed counting exercise. Twenty distinct cards are answered once on an illustrative day. Eighteen pass and two fail. The two failed cards are then answered ten more times each, and every repeat is marked as a pass. That repeated practice is an assumption chosen to make the arithmetic visible, not a recommended routine or a measured learning outcome.
| Counting rule | Passes / attempts |
|---|---|
| First attempt per card that day | 18 / 20 = 90% |
| Every attempt, including repeats | 38 / 40 = 95% |
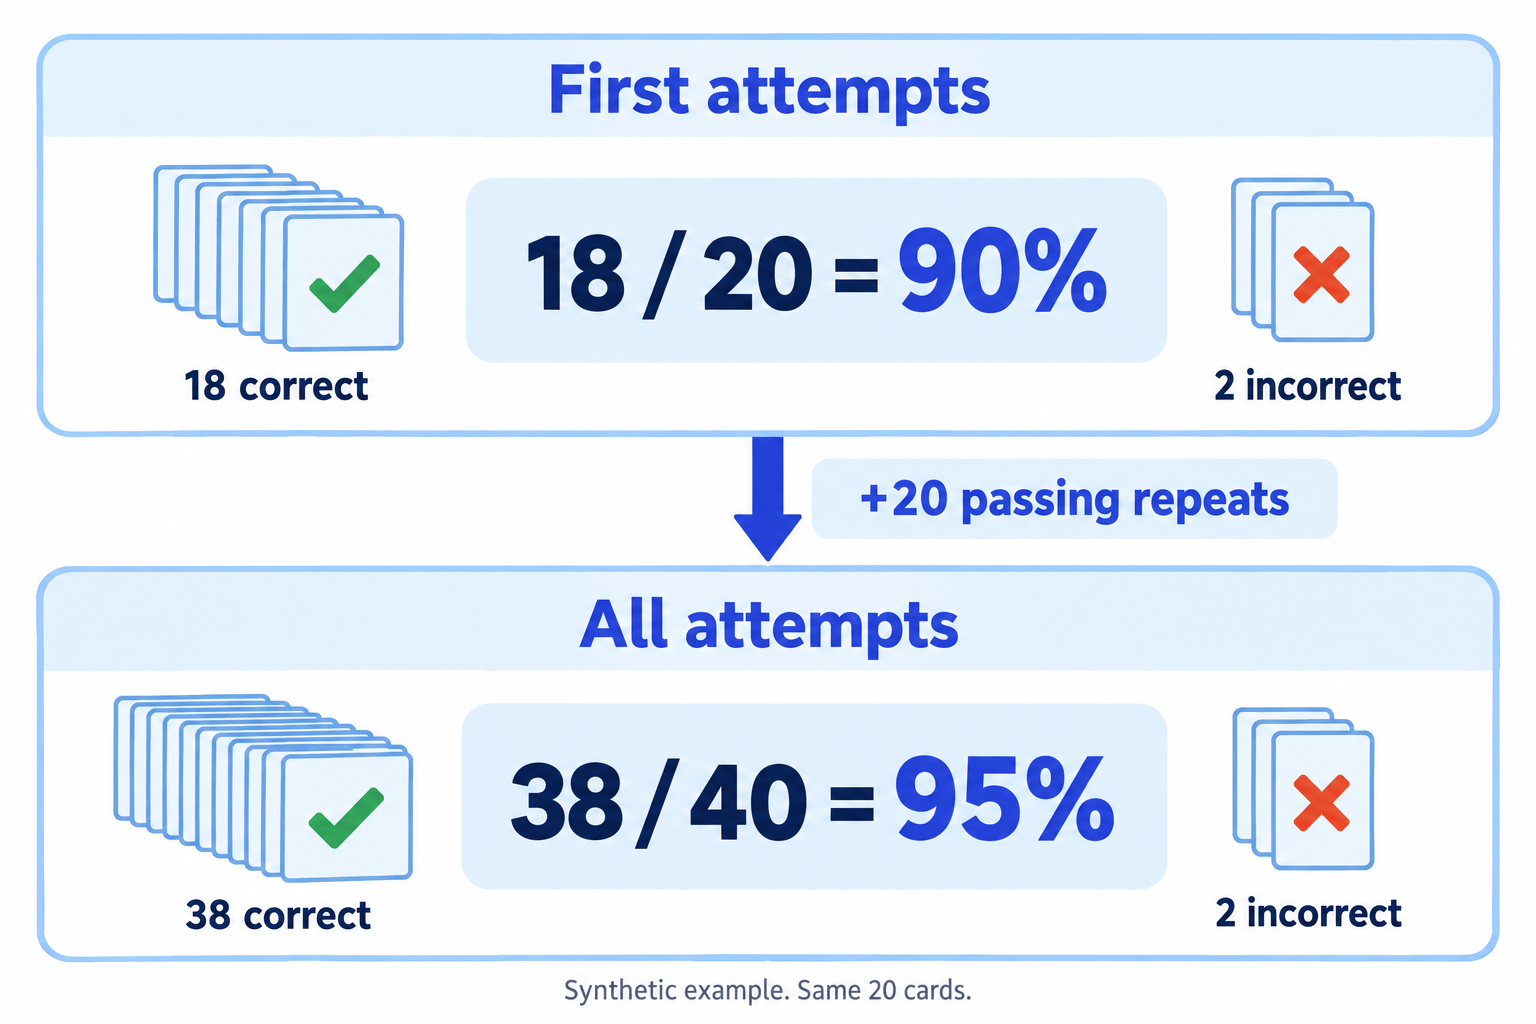
Nothing about the first twenty attempts improved retroactively. The second calculation includes another kind of event. It can be a valid description of all recorded attempts, but it cannot be substituted for first-attempt performance. There are still twenty distinct cards, not forty, and no delayed test in this example.
This distinction also matters inside a single app. Anki's Today section counts individual answer events, including repeated answers and learning cards. Its True Retention table uses the first review of each card per day, with Again as fail and Hard, Good, and Easy as pass. Read the specific report's definition before comparing screenshots.
Download the 40-row synthetic log to check both totals. Its card IDs are invented demonstration labels. It is not an export from a learner account, and the example illustrates counting rather than reproducing every eligibility rule in an app's statistics.
Why a 90% recall model can produce an 80% session
Now hold the counting rule fixed and change only the number of attempts. Suppose every attempt independently has the same 90% probability of passing. This is a simplified mathematical world: it has no memory changes, item difficulty, scheduling, fatigue, hints, or repeated-card dependence.
The NIST binomial-distribution reference gives the formula for the probability of each possible success count. We evaluated that formula for 20, 100, and 1,000 attempts. The table reports the smallest counts whose cumulative probabilities reach 5% and 95%, converted to percentages.
| Hypothetical attempts | 5th–95th percentile endpoints |
|---|---|
| 20 | 16–20 passes (80–100%) |
| 100 | 85–95 passes (85–95%) |
| 1,000 | 884–915 passes (88.4–91.5%) |
These are outcome ranges under an assumed probability, not confidence intervals fitted to your results. Counts are discrete, so the inclusive ranges contain about 95.7%, 93.6%, and 90.8% of the respective model distributions, rather than exactly 90%. The assumed probability remains 90% in all three rows.
With twenty attempts, each answer changes the observed percentage by five percentage points. A perfect twenty-out-of-twenty session has probability 0.9 to the power of 20, about 12.2%, in this model. That perfect session does not turn the assumed probability into 100%. Equally, sixteen passes do not by themselves prove the underlying probability has fallen to 80%.
More observations reduce random variation in this particular model. They do not repair a changed definition, selective inclusion of easy cards, or inconsistent grading. Real reviews also violate the model's simple assumptions: a failed card shown again shortly afterward is not an independent fresh draw from an unchanging recall probability. Do not turn the last row into a rule that everyone needs 1,000 reviews before making any useful decision.
Use a rate audit before changing your review routine
A percentage is most useful when you can explain the events behind it. Write the count next to the rate, keep the comparison window explicit, and inspect a few missed cards. The following checks separate a reporting change from a possible learning problem without pretending to diagnose either from one number.
- Name the included population. One deck, selected decks, or the full collection? New, learning, and older cards can produce different mixes.
- Record the event rule. All button presses or first attempts? Does the report exclude same-day repeats, suspended cards, or other events?
- Keep both counts. Record passes and eligible attempts alongside the percentage. Add distinct-card count if available; do not infer it from review count.
- Match the window and conditions. Compare the same duration and report definition. Note a new topic, a missed week, or a changed grading rule.
- Look at actual errors. Was the prompt ambiguous, the answer overloaded, or the response only recognized after flipping? Repair the specific card before drawing a collection-wide conclusion.
For example, a week of unfamiliar terminology and a week of established vocabulary answer different practical questions even if both reports cover seven days. A lower percentage might accompany harder material. A higher percentage might accompany extra same-session practice. Neither direction alone establishes improvement or decline.
Keep a brief note of one change and review it over a consistent window. Our study-tracking guide can help you record that context. If the missed cards are hard to judge, use the examples in writing clear flashcards to narrow each prompt. A useful next action is often one clearer question, not a new global setting.
A small practice deck for the two definitions
We entered two original definition cards in Memly's free browser flashcard maker: “Observed pass rate” and “Desired retention.” The screenshot below shows the actual tool with this editorial demo, not a generated interface or a learner's statistics dashboard.
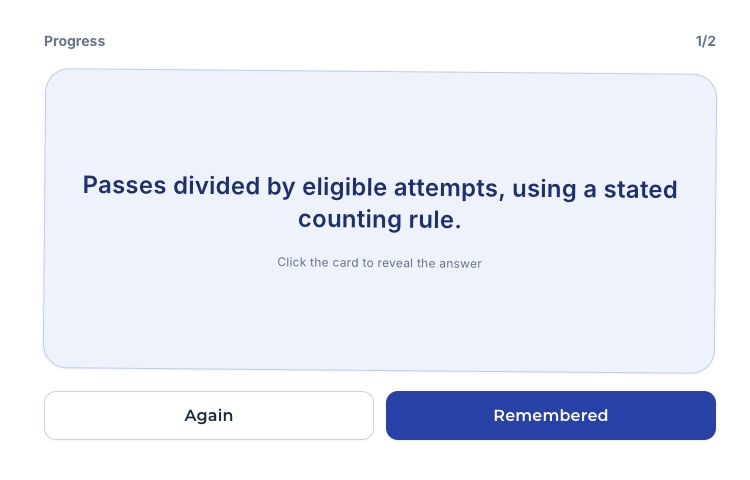
Try answering each term before revealing its definition. The two-card TSV contains the same wording. The free tool stores saved decks in the current browser and does not schedule future reviews. This demonstration did not test importing the cards into an account, synchronization, or long-term retention.
Reproduce the calculations and keep the limitations attached
Download the Python calculation script and run python3 calculate.py. It uses only the standard library, writes results beside the script, and requires no account or network request. It evaluates the binomial expression with 70-digit decimal precision; there is no random seed because no random sampling is used. The code also reconstructs the separate 40-event counting example.
The model-range CSV and full calculation record contain the unrounded values and assumptions. Checks cover probability totals, the model's mean and variance, a two-trial control, the perfect-session identity, and the synthetic log's totals. This is a worked probability calculation, not an FSRS implementation, an Anki simulator run, or a forecast for any particular learner.
For your own notes, use the blank rate-audit worksheet. Keep it local and include only information you need. Do not upload personal review histories merely to reproduce these examples; no private data is needed.
A useful sentence is: “This report records X passes out of Y eligible attempts, under this rule, during this window.” If you cannot fill in that sentence, check the report before interpreting its percentage. Then choose one missed prompt to improve or one stable comparison to track. Our guide to AI-assisted flashcard study connects card creation with a review routine you can actually inspect.
